Help / FAQ Statistics Page
FAQ Statistics Page
How do I register for the statistics page?
In the VR Coach smart system app, you will find the user icon in the top right corner. There is a link to the statistics page there.

If you are already logged into the app, you will be automatically redirected and logged in. Otherwise, you will be taken to the login page, where you can sign in using the same login credentials as in the app.
What can I do on the statistics page?
The statistics page provides a clear overview of all completed therapy sessions – including the date, duration, and scenario used. Each session can be individually named – for example, with the initials of the relevant person or an internal code.
Clicking on a session opens a detailed view with all completed or pending questionnaires for that session.

💡 Important: Use the same session name for all sessions of the same person so that the associated questionnaires and diagrams can be correctly assigned and displayed.
🔧 You can adjust the session name at any time – either directly in the overview list or within the detail view at the top left.


How can I create my own questions?
Under the “Edit Questions” menu, you can create as many custom questions as you like. Simply click on “Add New Question,” enter your question, and save it. These questions will then automatically appear in every new session and can be filled out there.

How are charts created?
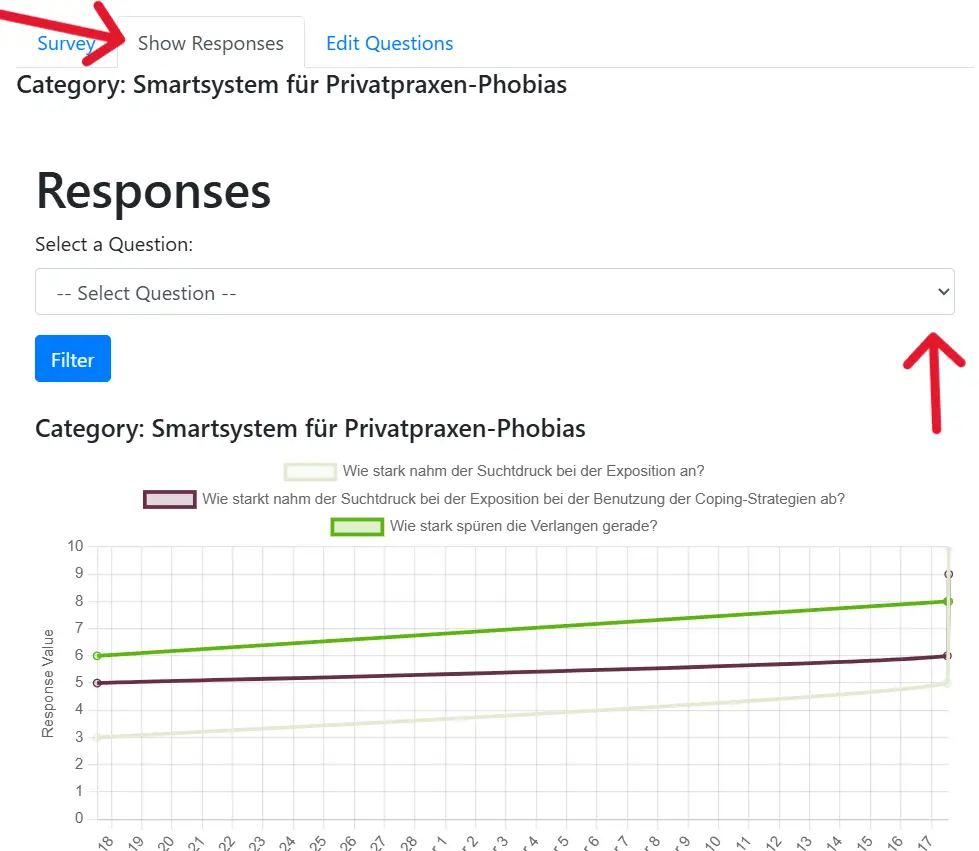
As soon as at least two sessions with the same session name and completed questionnaires are available, diagrams for visualizing the answers will be automatically generated.
Click on the respective session and select “Show Responses“. There, you will see the diagram as well as a list of all the entered responses. In the upper part of the view, you can also specifically select a particular question to analyze the trend of that response across multiple sessions.
If you don’t find answers here, we are happy to assist you by phone or email!